Benchmark and compare multiple `mdist()` specifications
benchmark_mdist.RdApplies [mdist()] repeatedly over a tibble of distance-method specifications, typically generated with [all_dist_method_specs()]. It then compares every pair of successful distance specifications using distance, configuration, and optional clustering diagnostics.
Usage
benchmark_mdist(
  x,
  response = NULL,
  specs = all_dist_method_specs(),
  dims = 2,
  cluster_k = NULL,
  cluster_methods = c("pam", "hclust", "spectral"),
  hclust_method = "average",
  spectral_sigma = NULL,
  spectral_nstart = 50
)
Arguments
- x
A data frame or tibble of predictors, optionally including the response column.
- response
Optional response column inside `x`, supplied either unquoted or as a character string.
- specs
A tibble of method specifications. By default, this is generated with [all_dist_method_specs()]. It must contain the columns `preset`, `method_cat`, `method_num`, and `commensurable`. An optional `label` column supplies display labels for comparisons and plots.
- dims
Integer. Number of dimensions used by classical multidimensional scaling when computing congruence and alienation coefficients.
- cluster_k
Optional integer. Number of clusters used for pairwise adjusted Rand indices. If `NULL`, no clustering is performed.
- cluster_methods
Character vector specifying the clustering methods used when `cluster_k` is supplied. Possible values are `"pam"`, `"hclust"`, and `"spectral"`.
- hclust_method
Character string specifying the linkage method passed to [stats::hclust()] when `"hclust"` is requested.
- spectral_sigma
Optional numeric value for the Gaussian affinity bandwidth used by spectral clustering. If `NULL`, the default used by [spectral_dist()] is applied.
- spectral_nstart
Integer. Number of random starts used by the k-means step in spectral clustering.
Value
An object of class `"MDistBenchmark"`, which is also a tibble. It contains the supplied specifications together with:
- result
The corresponding output of [mdist()], or an error object if the specification failed.
- ok
Logical indicator; `TRUE` if the run completed successfully, `FALSE` otherwise.
- error
Error message for failed runs, `NA` otherwise.
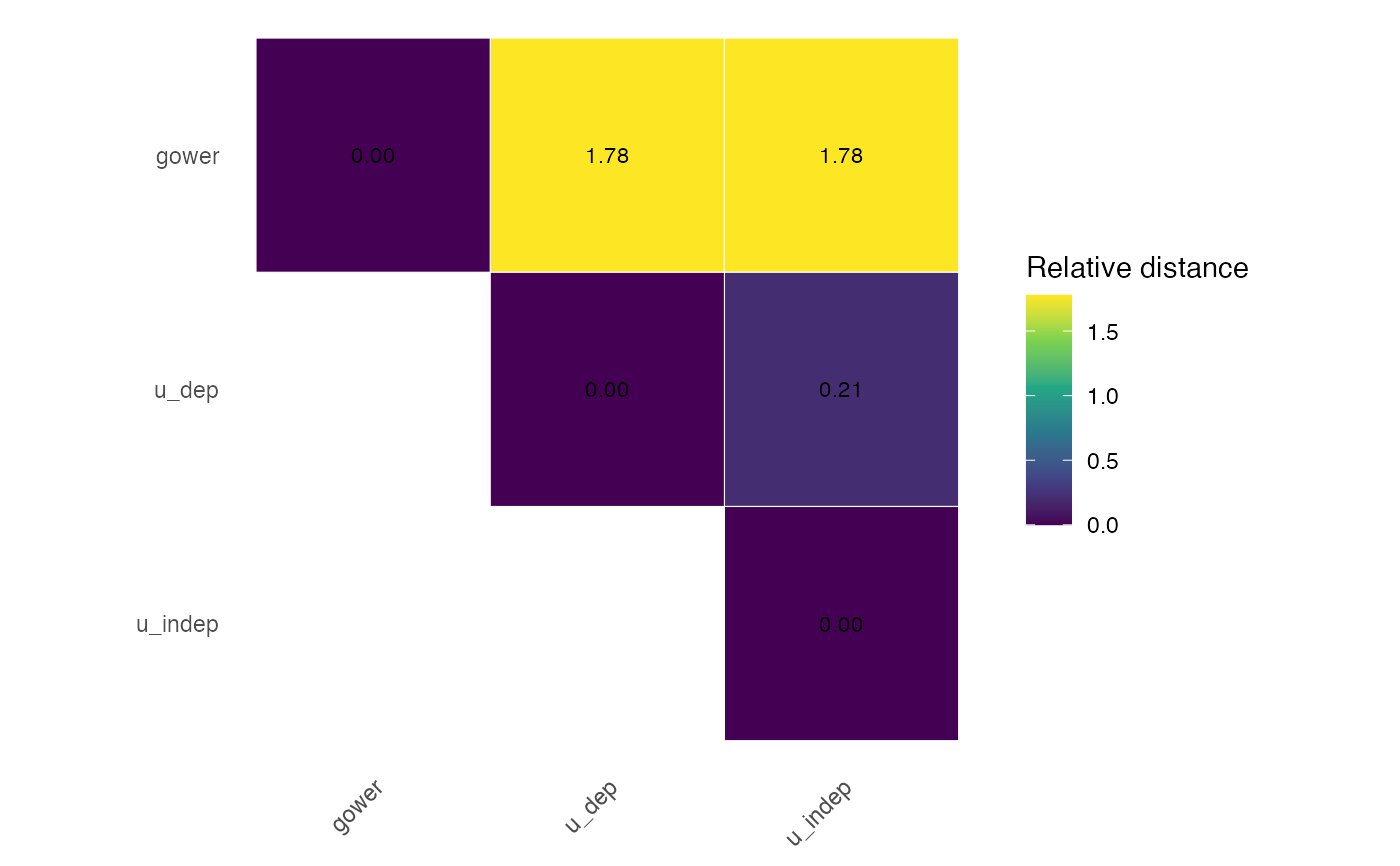
Use `summary()` to display upper-triangular tables of pairwise diagnostics and invisibly obtain their complete tibble, and [ggplot2::autoplot()] to draw an annotated triangular heatmap. The default print method displays a compact run overview; use `tibble::as_tibble()` to inspect the complete underlying run table.
Details
Each row of `specs` is interpreted as one valid `mdist()` configuration. Preset-based and custom specifications are both supported. Failed specifications are caught and returned in the output rather than stopping the full benchmark.
Preset specifications use the `preset` column and ignore `method_cat`, `method_num`, and `commensurable`. Component specifications are evaluated as `preset = "custom"` and use `method_cat`, `method_num`, and `commensurable`.
Pairwise mean absolute difference (`mad`) is computed from the lower triangle of each dissimilarity matrix. The symmetric relative distance is defined as $$ \frac{2\,\mathrm{mean}(|d_a-d_b|)} {\mathrm{mean}(|d_a|)+\mathrm{mean}(|d_b|)}. $$ Classical multidimensional scaling configurations are compared using [congruence_coeff()]. The corresponding alienation coefficient is \(\sqrt{1-c^2}\).
When `cluster_k` is supplied, each requested clustering method is applied once to every successful distance specification. Partitions produced by the same clustering method are then compared pairwise using the adjusted Rand index. When `cluster_k = NULL`, no clustering is performed and no ARI columns are included in the comparisons.
Examples
if (requireNamespace("palmerpenguins", quietly = TRUE)) {
  data("penguins", package = "palmerpenguins")

  penguins_small <- palmerpenguins::penguins |>
    dplyr::select(
      species, bill_length_mm, bill_depth_mm, flipper_length_mm,
      body_mass_g, island, sex
    ) |>
    tidyr::drop_na()

  specs <- all_dist_method_specs(
    preset = c("gower", "u_indep", "u_dep")
  )

  res <- benchmark_mdist(
    penguins_small,
    response = species,
    specs = specs
  )

  res
  pairwise_results <- summary(res)
  ggplot2::autoplot(res, metric = "relative_distance")
}
#> Warning: For method(s) 'matching', category dissimilarities do not depend on conditional profiles; `response` was therefore ignored.
#> Summary of MDistBenchmark
#>   specifications : 3
#>   successful     : 3
#>   failed         : 0
#>   comparisons    : 3
#>
#> Pairwise diagnostics (upper triangle; diagonal omitted):
#>
#> mad:
#>         gower u_dep u_indep
#> gower         5.663   5.663
#> u_dep                 1.266
#> u_indep
#>
#> relative_distance:
#>         gower u_dep u_indep
#> gower         1.777   1.777
#> u_dep                 0.210
#> u_indep
#>
#> mds_congruence:
#>         gower u_dep u_indep
#> gower         0.982   0.990
#> u_dep                 0.961
#> u_indep
#>
#> alienation:
#>         gower u_dep u_indep
#> gower         0.189   0.141
#> u_dep                 0.278
#> u_indep